How are project funds allocated towards sustainability?
How does the Philippine government allocate funds for sustainability projects, and what priorities are their current priorities?

Cities for All: A Closer Look at SDG 11 Implementation
What is SDG 11?
Sustainable Development Goal 11 (SDG 11) aims to "Make Cities and Human Settlements Inclusive, Safe, Resilient, and Sustainable". As urban areas are rapidly growing to cater to the increase in population, this Development Goal addresses how we need to build our cities to be livable and environmentally friendly while also resilient in the face of climate change and disasters.
SDG 11 focuses on a number of key areas regarding urban development such as accessible transport, disaster risk reduction, and environmental sustainability. It advocates for improvements on air quality, green spaces and waste management among others in communities that are overlooked. These initiatives are especially vital for marginalized and underserved communities, which are often overlooked in national development plans.
Projects of the Philippines
The Philippines has launched numerous projects and initiatives that align with the goals of SDG 11. Through national planning, projects are led by agencies like the National Economic and Development Authority (NEDA) which aim to improve transportation, housing, disaster risk reduction, and access to basic services. Some notable projects in the different areas of development are shown below
Housing: New Clark City Affordable Housing
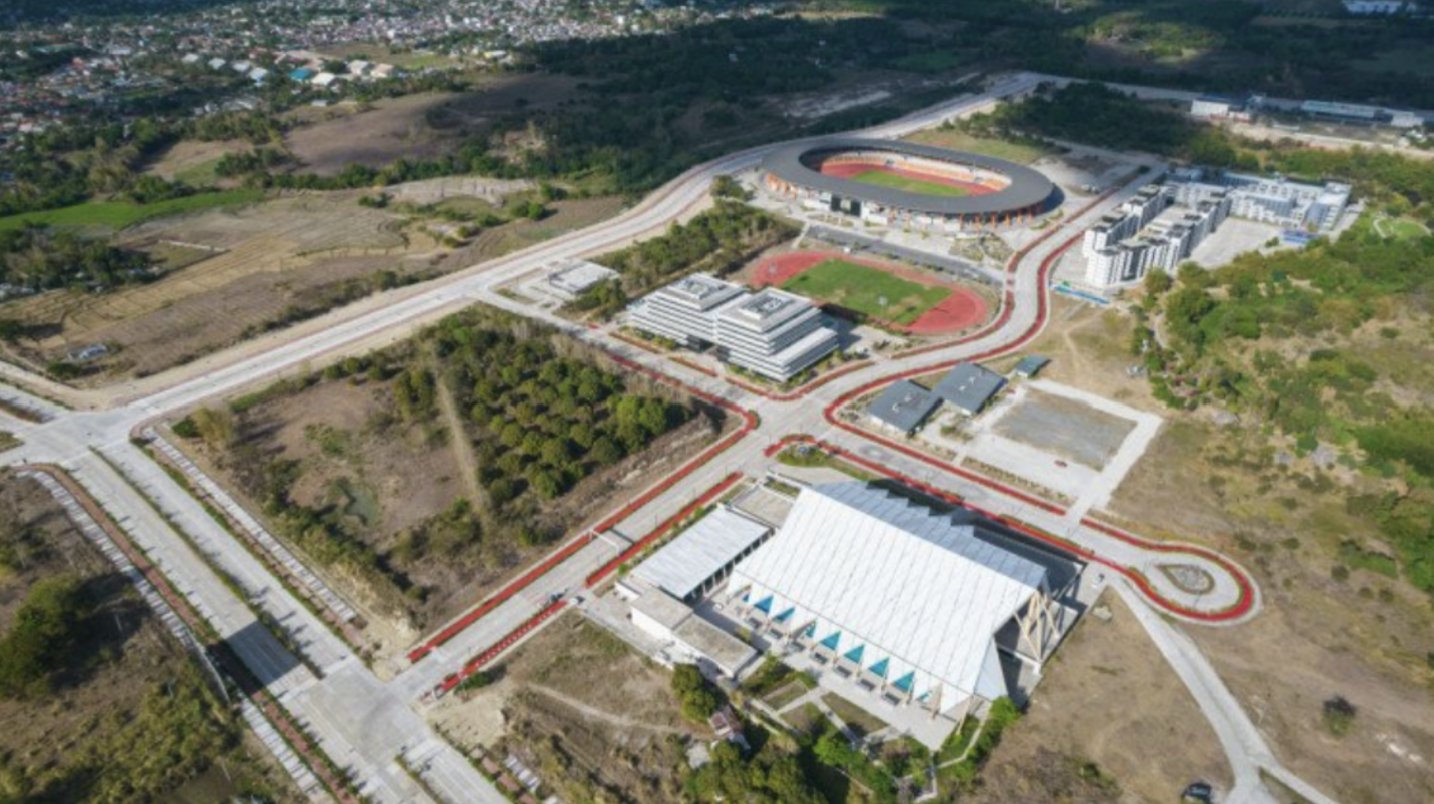
The Bases Conversion and Development Authority plans to collaborate with South Korean companies such as Saekyung Realty Corporation and Overseas Infrastructure and Urban Development Corporation as well as local companies like Sta. Clara International Corporation.
The goal of this project is to create affordable housing in New Clark City, complemented with infrastructure that aligns with SGD 11 such as green spaces, transportation networks and disaster resiliient infrastructure (Bases Conversion and Development Authority).
Bases Conversion and Development Authority. (n.d.). BCDA, consortium eye building 61-hectare low-cost housing complex in New Clark City. https://bcda.gov.ph/news/bcda-consortium-eye-building-61-hectare-low-cost-housing-complex-new-clark-city
Disaster Risk Reduction integrated disaster risk reduction and climate change adaptation: Pampanga Bay
Pampanga experiences severe flooding due to a combination of geographical and climate conditions. First the area is regularly hit by monsoons and typhoons which bring heavy rainfall. Second, Pampanga is situated on an alluvial plain which makes it prone to flooding because of the limited space for rainwater and river networks to spread out (Naguno and Sawano).
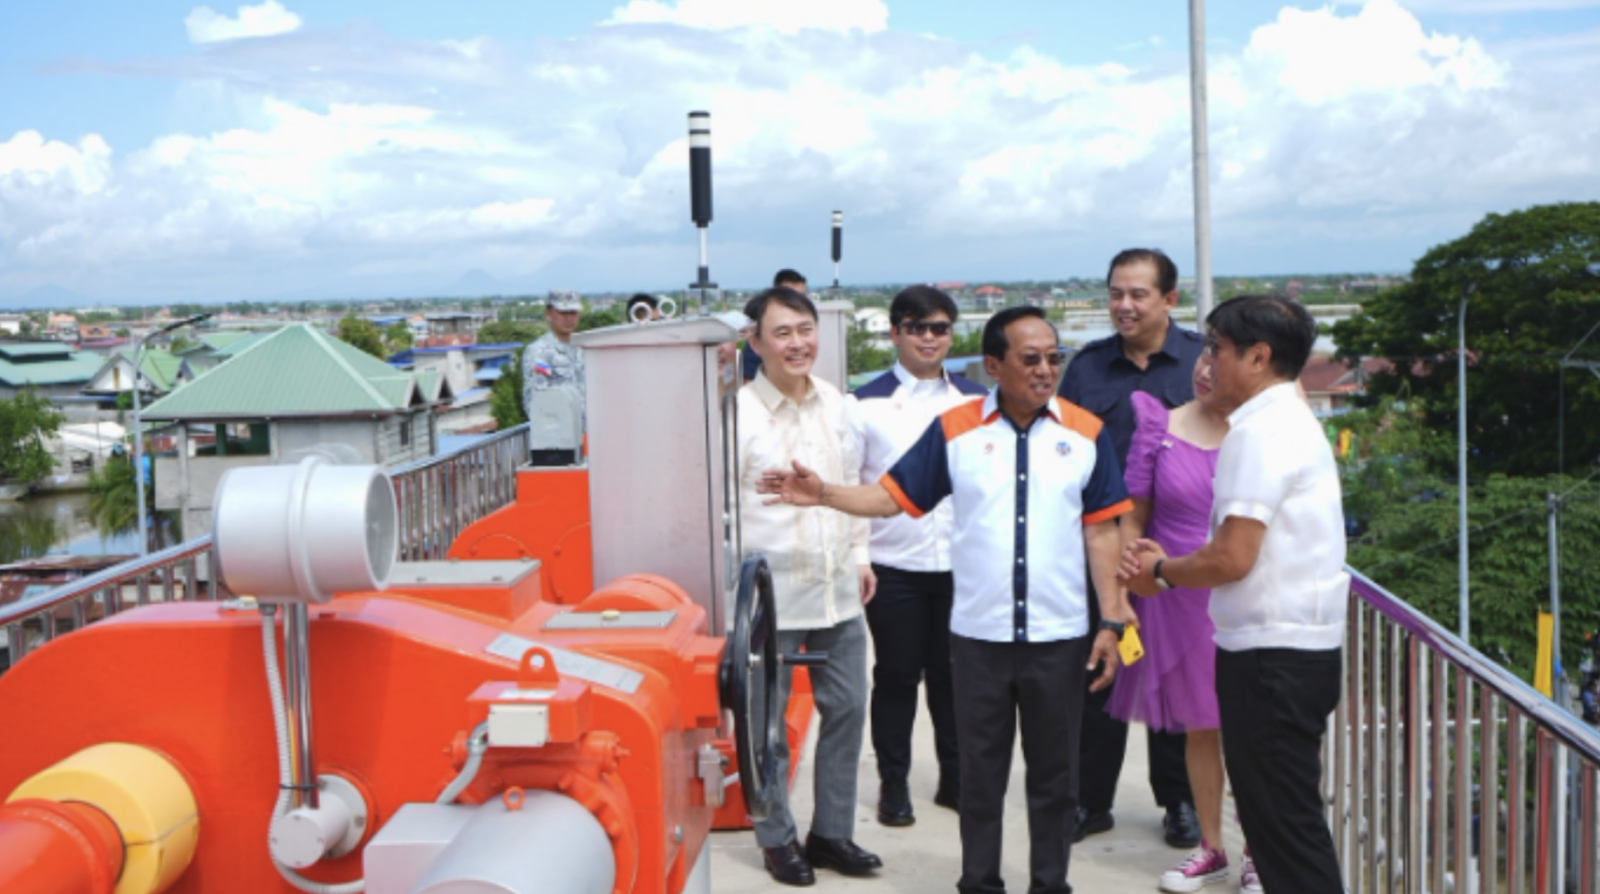
The Integrated Disaster Risk Reduction and Climate Change Adaptation (IDRR-CCA) Measures in Low Lying Areas of Pampanga Bay is implemented by the DPWH with funding from the Korean Economic Development and Cooperation Fund (KEDCF), This project aims to solve the flooding problem in Pampanga by improving the flooding infrastructure such as the drainage system. (Department of Public Works and Highways)
Department of Public Works and Highways. (2024, December 9). President Ferdinand R. Marcos Jr. leads inauguration of Pampanga Bypass Road. https://www.dpwh.gov.ph/dpwh/news/35112/
Nagumo, N., & Sawano, H. (2016). Land classification and flood characteristics of the Pampanga River Basin, Central Luzon, Philippines. Journal of Geography (Chigaku Zasshi), 125(5), 699–716. https://doi.org/10.5026/jgeography.125.699
Our Motivation
While these initiatives demonstrate how the projects of the Philippines align with the goals of SDG 11, they also expose a pattern: these projects are mostly centered around Metro Manila. The lack of regional focus begs the question – are other communities being left behind in terms of national planning and infrastructure development?
In light of this pattern, we set out to investigate the national projects for sustainability. Understanding what the projects are about, how it is implemented and how resources are allocated among them offers us insights about the governments priorities. By doing so, we can uncover if these developmental efforts are inclusive of different communities, and if it solves our unique challenges.
Research Design
We wanted to ask...
How does the Philippine government allocate funds for sustainability projects, and what priorities are their current priorities?
Background of the Study
SDG 11 goal is to "Make Cities and Human Settlements Inclusive, Safe, Resilient, and Sustainable". According to the United Nations, this SDG tackles problems related to transport, housing, and sustainable development such as Disaster Risk Reduction, accessibility, and minimization of environmental impact.
Key performance indicators are used to quantify the SDG and according to the SDG watch released by the Philippine Statistics Authority, the Philippines is far from reaching the desired goals for 2023. These indicators include:
- 11.1.1p1: Proportion of urban population who are informal settlers
- 11.5.1: Number of deaths, missing persons and directly affected persons attributed to disasters per 100,000 population
- 11.6.2.p1: Percentage of highly urbanized and other major urban centers within ambient air quality guidelines value increased
This study uses a dataset from NEDA which contains the state current and future projects of the Philippines to investigate the different projects being implemented by the government.
Research Problems
1. How are project funds allocated towards sustainability?
Investigate how funds are distributed between sustainability projects as opposed to other projects
2. What kind of sustainability projects is the current government focused on?
Investigate how funds are distributed between different sustainability projects
3. Which sectors/regions does the government prioritize?
Investigate the distribution of funds according to location
Hypotheses
Null Hypothesis:
There is no significant difference in budget allocation per type of project.
Alternate Hypothesis:
There is a significant difference in budget allocation per type of project.

Dataset
Description
The Infrastructure Flagship Projects (IFP) 2024 Dataset, compiled by the National Economic Development Authority (NEDA), provides a comprehensive overview of the status and progress of the national government's infrastructure initiatives. NEDA aggregates this data yearly to track the status of major government projects. It includes key project details such as title, affected sector, implementing agency, cost and funding allocation, funding source, development partners, geographic coverage, target completion year, and current status at the time of data collection. By analyzing the diverse data points in this dataset, we can gain insights into the government's priorities regarding sustainability and urban planning.
Content
- TITLE: Title of the project.
- SECTOR: Sector/focus that would benefit from the project. This includes: Physical Connectivity, Water Resources, Agriculture, etc.
- IMPLEMENTING AGENCY: Government agency responsible for the development of the project. This includes: DPWH, DOTR, DICT, etc.
- INDICATIVE PROJECT COST: The agreed cost of the project.
- FUND SOURCE: Source of the funding of the project. These include: GAA (General Appropriations Act), ODA (Official Development Assistance), PPP, etc.
- DEVELOPMENT PARTNER: External or foreign development partner for the project. This can include support from countries like Japan, China, France, etc., or private companies, like AUB and ADB.
- REGION: Geographical regions covered by the project. This includes: NCR, Region I, Region II, etc.
- TARGET COMPLETION YEAR: Proposed year the project would be completed.
- STATUS/MILESTONE: Current progress/stage of the project. This includes: Completed, Ongoing, Approved for implementation, Under project preparation, etc.
Data Collection
The dataset will be taken from NEDA's IFPs. The dataset can be found at their website.
Sampling Method
Due to the relatively smaller dataset (186 entries), further reducing the data by extracting samples may exclude certain projects/sectors/regions and may introduce biases. We have decided to study the dataset as is to analyze all relevant data points.
Dataset Size
Investigate how funds are distributed between different sustainability projects
Preprocessing
Investigate the distribution of funds according to location
Hypotheses
Null Hypothesis:
There is no significant difference in budget allocation per type of project.
Alternate Hypothesis:
There is a significant difference in budget allocation per type of project.
Exploratory Data Analysis
Project Distribution Overview
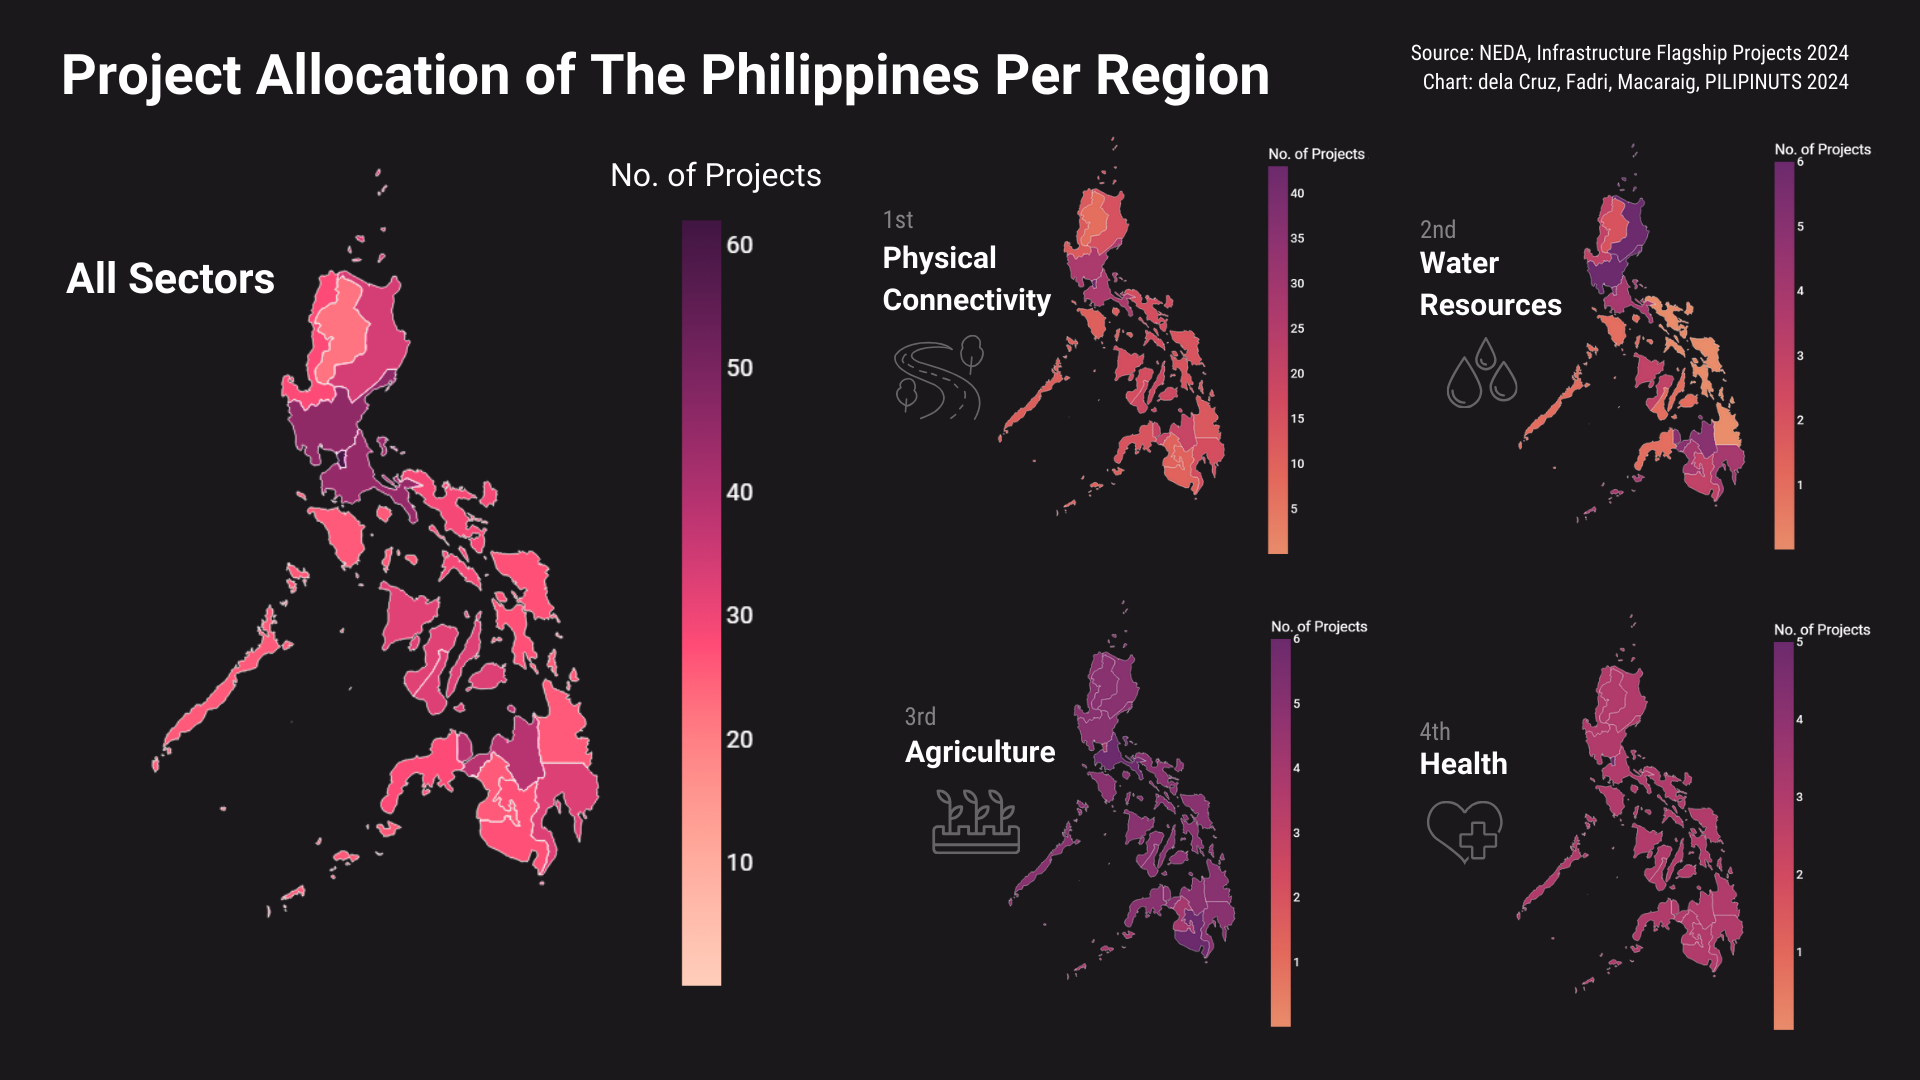
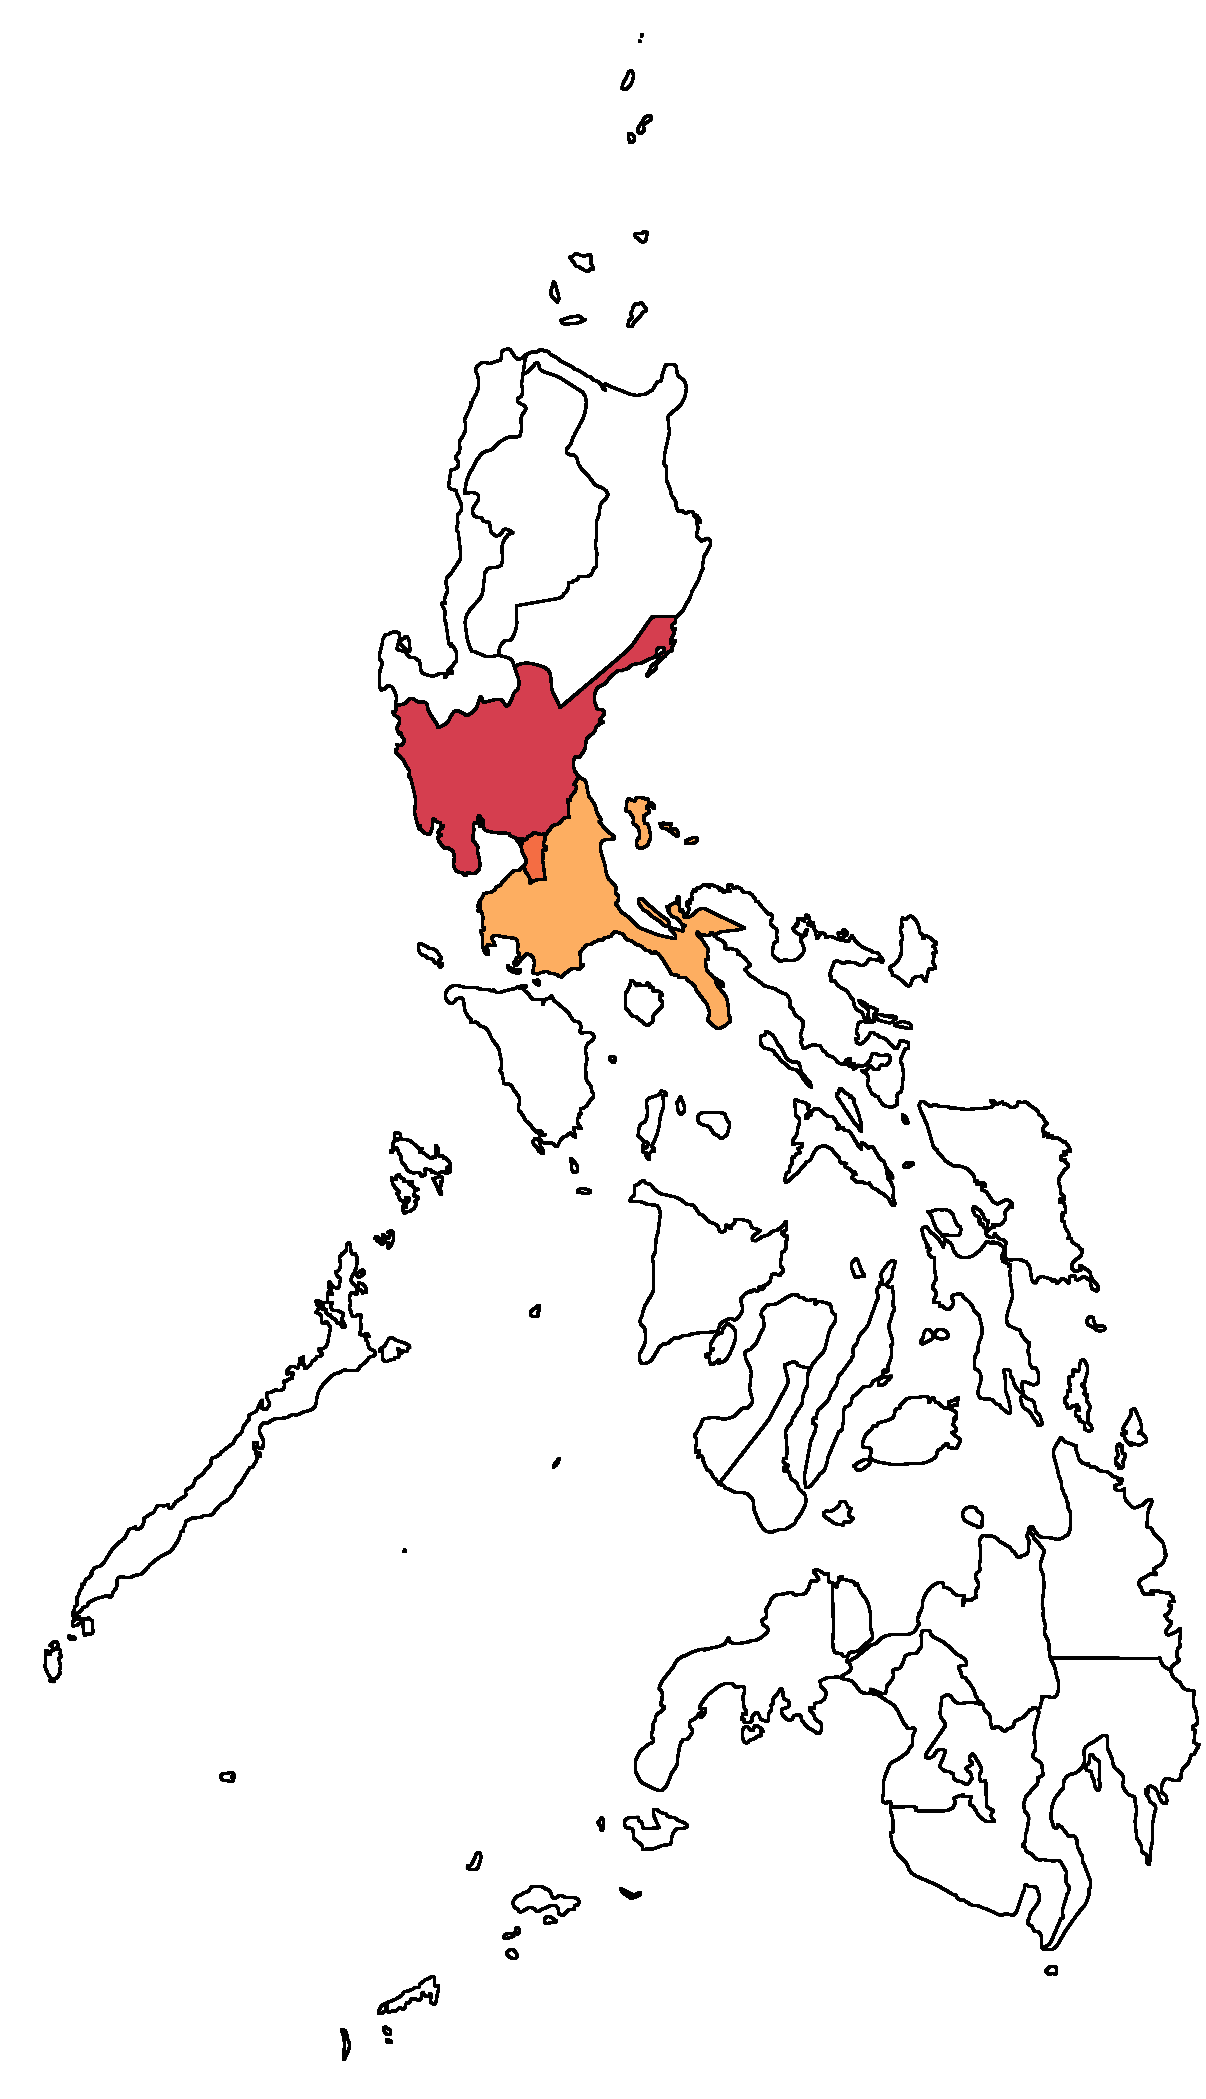
This choropleth map shows the distribution of sustainability projects per region around the Philippines. It can be seen that the majority of projects are concentrated around Region III, IV-A, and NCR. This can mainly be attributed to those regions being part of three large projects: the North-South Commuter Railway, the Bulacan International Airport, and Subic-Clark-Manila-Batangas Dedicated Rail Corridor. Furthermore, most of the projects regarding sustainability are classified as "Physical Connectivity" projects, in other words: projects regarding transportation and connectivity of locations. There are around four times more Physical Connectivity projects compared to Water Resources projects, which is the second most common type. There appears to be an inequality in the number of projects per project type along with per region.
Project Fund Allocation Analysis
1. How are project funds allocated towards sustainability?
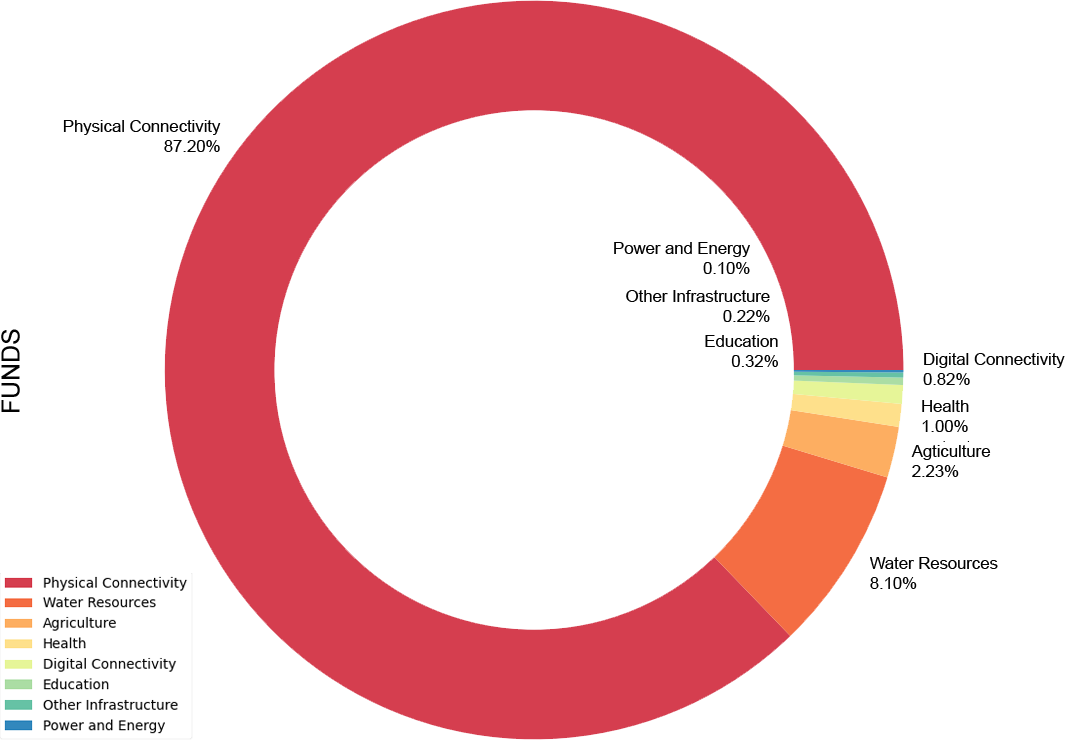
Total amount of funds allocated: PHP 9.5684 Trillion
Percentage of funds allocated to each sector
| Sector | Indicative Project Cost (in Php B) | % |
|---|---|---|
| Physical Connectivity | 8,343.71 | 87.20 |
| Water Resources | 775.07 | 8.10 |
| Agriculture | 213.68 | 2.23 |
| Health | 95.73 | 1.00 |
| Digital Connectivity | 78.11 | 0.82 |
| Education | 30.56 | 0.32 |
| Other Infrastructure | 21.34 | 0.22 |
| Power and Energy | 10.19 | 0.10 |
| TOTAL | 95,684 | 100 |
It can be seen that the sector that is most invested on is Physical Connectivity, with the majority of funds allocated going towards it.
Investigating further to see the ten most expensive projects:
Table containing the ten most expensive projects
| Rank | Project Title | Sector | Indicative Project Cost (in Php B) | Region/s |
|---|---|---|---|---|
| 1 | North-South Commuter Railway (PNR North 1,PNR North 2,PNR South Commuter) | Physical Connectivity | 873.62 | NCR, III, IV-A |
| 2 | New Manila International Airport (Bulacan International Airport) | Physical Connectivity | 735.63 | III |
| 3 | Subic-Clark-Manila-Batangas Dedicated Rail Corridor | Physical Connectivity | 657.75 | NCR, III, IV-A |
| 4 | Metro Manila Subway Project Phase 1 | Physical Connectivity | 488.48 | NCR |
| 5 | North Long Haul Railway | Physical Connectivity | 400.00 | I, II, III |
| 6 | Daang Maharlika (N1) Improvement | Physical Connectivity | 251.19 | NCR, I, II, III, IV-A, V, VIII, IX, X, XI, XII, XIII, BARMM |
| 7 | MRT Line 5 | Physical Connectivity | 250.00 | NCR |
| 8 | Metro Manila Subway Project - Phase 2 | Physical Connectivity | 247.50 | NCR, III, IV-A |
| 9 | Bataan-Cavite Interlink Bridge | Physical Connectivity | 219.31 | III, IV-A |
| 10 | Panay-Guimaras-Negros Inter-Island Link Bridge | Physical Connectivity | 187.53 | VI |
The 10 most expensive projects are all Physical Connectivity projects, amounting to PHP 4.31101 Trillion in allocated funds.
6 out of the 10 projects are railway projects,
amounting to PHP 2.91735 Trillion.


The second most expensive project is the New Manila International Airport (Bulacan International Airport) at PHP735.63 Billion pesos.
The remaining three projects are all road related, amounting to PHP 658.03 Billion pesos.
Seven of the most expensive projects include region III,
while six include NCR,
and five include region IV-A.
Hypothesis Testing
The hypothesis testing applies chi-square goodness-of-fit test and the Kolmogorov-Smirnov test to evaluate whether the actual allocation of projects and project funds in the Philippines aligns with an equal distribution or a distribution based on the regional population. Through these tests, we will see if the government prioritizes each region equally with each project.
Projects by Count
We will be using the chi-square goodness-of-fit to check whether the allocation of projects between each region is uniform or if it follows the population distribution across regions. Doing this helps us assess if resources are being distributed fairly across regions. The categorical data would be the region, and each project was divided based on the number of regions affected to make them mutually exclusive. The expected number of projects per region is either equal or according to the population which is significantly large (5 or more).

A Chi-Square Goodness of Fit test will be used for the hypothesis testing at a 95% confidence interval
Chi-square test statistic: 105.337, p-value: 9.035e-15
Since p < 0.05, we reject the null hypothesis
Sustainability projects are not evenly distributed among regions in the Philippines

A Chi-Square Goodness of Fit test will be used for the hypothesis testing at a 95% confidence interval
Chi-square test statistic is: 31.593, p-value: 0.011
Since p < 0.05, we reject the null hypothesis
Sustainability projects are not distributed proportionally to the population of each region as a fraction of the total population.
Projects by Funding
We will be using the chi-square goodness-of-fit to check whether the fund allocation of projects between each region is uniform or if it follows the population distribution across regions. Again, doing this helps us assess if resources are being distributed fairly across regions. The categorical data would be the region, and each project's fund was divided based on the number of regions affected to make them mutually exclusive. We will treat each project fund similar to the count in the previous test. We think that the chi-square goodness of fit is more suitable because regions are treated as categories and a test like Kolmogorov-Smirnov is designed for continuous distributions and would be less appropriate, as it focuses on comparing cumulative distribution functions rather than categorical proportions.

A Chi-Square Goodness of Fit test will be used for the hypothesis testing at a 95% confidence interval
Chi-square test statistic is: 14926.666, p-value: 0.0
Since p < 0.05, we reject the null hypothesis
The funding of Sustainability projects are not evenly distributed among regions in the Philippines

A Chi-Square Goodness of Fit test will be used for the hypothesis testing at a 95% confidence interval
Chi-square test statistic is: 3723.782, p-value: 0.0
Since p < 0.05, we reject the null hypothesis
The funding of Sustainability projects are not distributed proportionally to the population of each region as a fraction of the total population.
Hypothesis Conclusion
We can see that from the different Hypothesis tests, the allocation of project resources is not aligned with the uniform distribution or the population based distribution. The resource distribution is uneven and policy adjustments may be warranted to ensure equitable allocation across regions. Additionally, the different graphs and plots show us that the projects are concentrated in Luzon, specifically NCR which reflects a more centralized approach to development.
EDA Discussion
It can be seen from the EDA conducted, that a majority of the sustainability projects listed in the 2024 IFP Dataset are physical connectivity projects, mainly concerning transportation and roads. Furthermore, a majority of the funds and projects are concentrated in the central Luzon area including Regions III, IV-A, and NCR.
The top ten most expensive projects are all Physical Connectivity projects. The most expensive project, at Php 873.62, is the North-South Commuter Railway in regions III, IV-A, and NCR. The second most expensive is the New Manila International Airport (Bulacan International Airport) at Php 735.63 for region III.
Of the ten most expensive projects, six of them are railway projects at PHP 2.917 Trillion total, three are road projects at PHP 658.03 Billion, and the last one is an airport project at Php 735.63. Seven of the most expensive projects include region III, while six include NCR, and five include region IV-A.
Furthermore, Physical Connectivity projects amount to 87.20% of the funds allocated, with the the second most funded being Water Resources only amounting to 8.10% of the budget, and the third most funded being Agriculture at only 2.23% of the budget.
Based on the results from the dataset, it can be seen that the government mostly prioritizes Physical Connectivity projects, with a focus on Regions III, IV-A, and NCR.
Despite these results, it is not truly enough to draw a definitive conclusion on what the government is really prioritizing. The top ten most expensive projects mentioned are all major development projects that are mostly in the foundational and construction stages. The data for the funding does not take into account the timeline of each project, nor their current status. Additionally, each project has different implementing agencies, funding sources, and development partners, which were not taken into account for this study. These factors can be further investigated in order to give a more complete picture. Another possible avenue for further study is the analysis and comparison of projects within project types or within regions.
Modelling
K-Means Clustering
In order to gather deeper insights into the structure and thematic similarities of infrastructure projects, we applied unsupervised clustering techniques to the dataset. The primary objective was to group projects based on textual and categorical features, particularly the project titles (stop words and common terms like "project" or "plan" were removed), sector, and regions. By doing so, we can uncover patterns and recurring themes that may not be immediately evident through raw data inspection, and we can get a better look at where our national government places their priorities in terms of sustainability projects.
We applied K-Means clustering, a method that finds natural groupings in the data without needing predefined categories. Project titles were converted into numerical form using TF-IDF, which highlights important keywords and reduces the impact of common words like "project" or "development."
Due to the sector distribution of the projects, the projects were split into Physical Connectivity and non-Physical Connectivity groups. Each group was then clustered into 4 groups.
Physical Connectivity Projects
Below is a PCA Projection of the Physical Connectivity Projects clusters. As seen in the figure, there is quite a bit of overlap between the clusters. This may be due to the fact that most of the projects in the physical connectivity center have very similar titles. We can see this in the word clouds presented below.
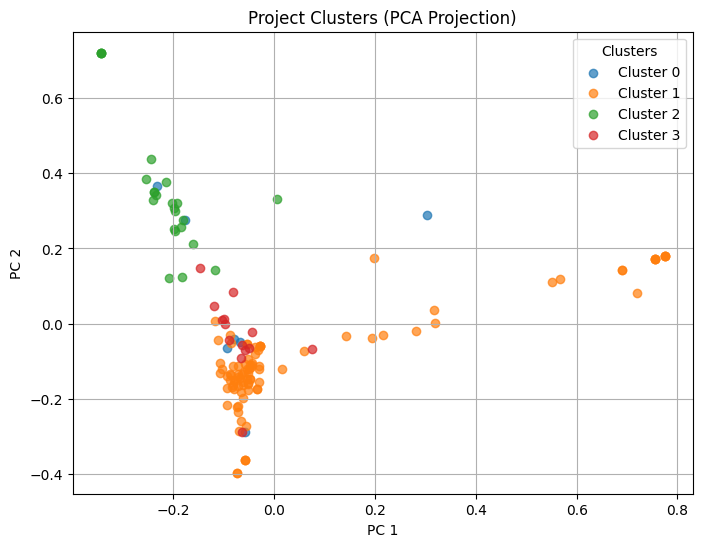
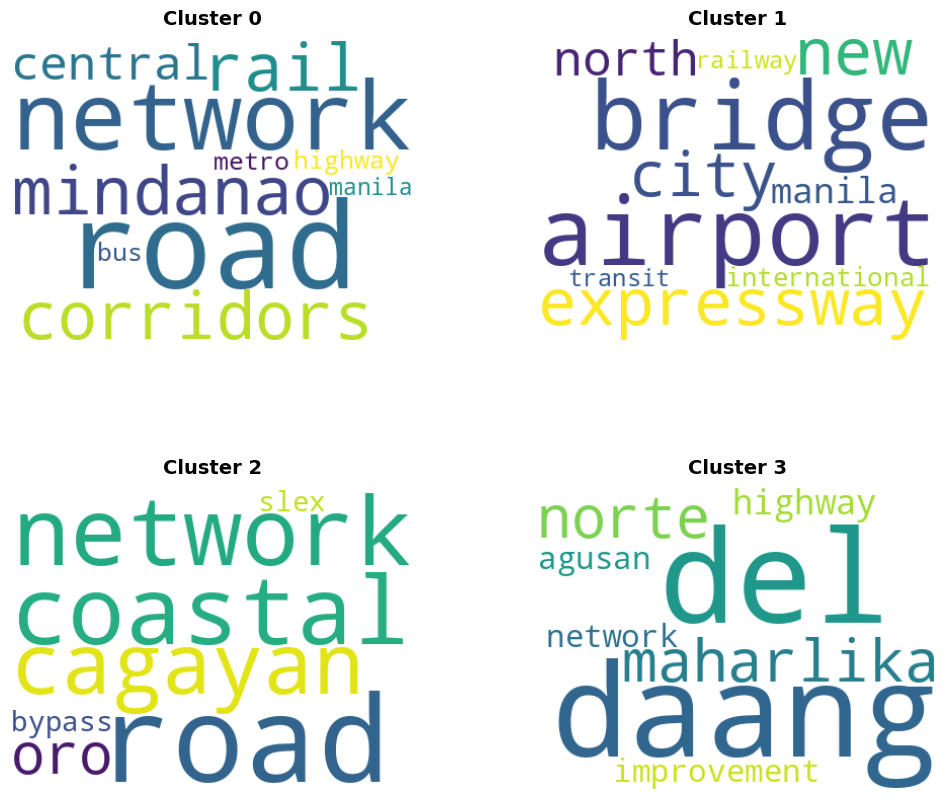
- Cluster 0 (7 projects): This cluster deals with networks, rails, and highways—likely representing major corridor or interregional connectivity projects focused on central Mindanao and Metro Manila.
- Cluster 1 (92 projects): This is the largest cluster, containing many large-scale infrastructure projects such as airports, expressways, bridges, and transit systems—primarily around Metro Manila and major cities.
- Cluster 2 (24 projects): This group appears to focus on bypasses and coastal roads, especially in Southern Luzon and Mindanao, including key networks in Cagayan de Oro and areas near SLEX.
- Cluster 3 (14 projects): Projects in this cluster highlight improvement works on existing highways, with repeated mention of Daang Maharlika and regions like Agusan del Norte—suggesting a focus on rehabilitation rather than new builds.
While there is some thematic overlap (e.g., many projects involve roads or transport corridors), clustering helped highlight subtle differences in project scale, geographic focus, and type (e.g., new builds vs. improvements).
Non-Physical Connectivity Projects
Below is a PCA Projection of the Non-Physical Connectivity Projects clusters. Compared to the PCA projection of the Physical Connectivity projects, we see less overlap; likely due to the more varied sectors, regions, and plans with these projects.
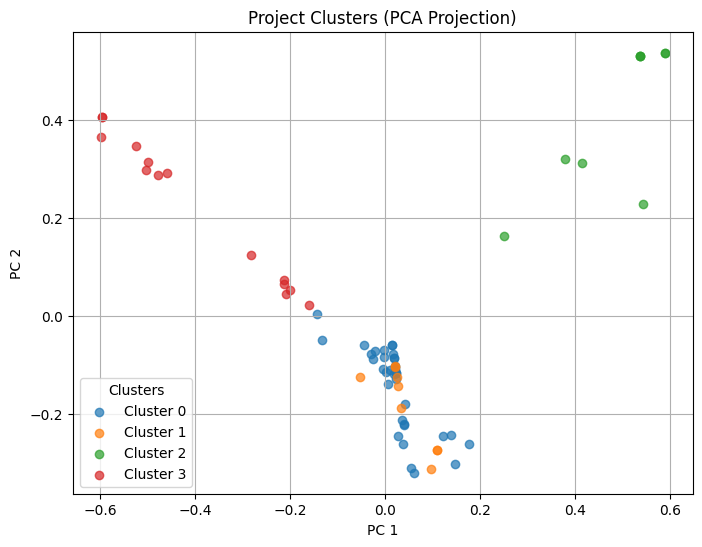
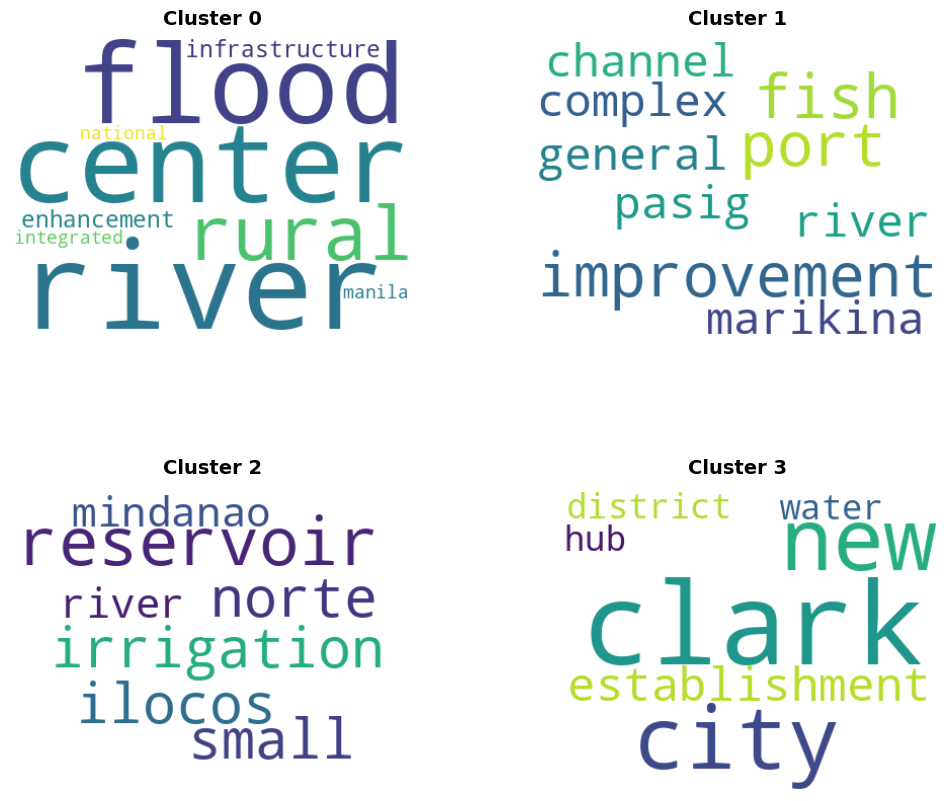
- Cluster 0 (36 projects): This cluster centers on flood control and water infrastructure such as river systems, rural water systems, and national-level flood risk management—especially in Manila and surrounding areas.
- Cluster 1 (9 projects): These projects mostly relate to waterway improvements and port infrastructure, with repeated mentions of river channels and specific sites like the Pasig and Marikina Rivers.
- Cluster 2 (9 projects): This cluster focuses on irrigation systems, including small reservoir projects in Mindanao and Northern Luzon (e.g., Ilocos Norte) which might likely be agricultural support infrastructure.
- Cluster 3 (14 projects): A more mixed category, but largely tied to developments in Clark (e.g., New Clark City) and district hubs that suggest a focus on urban expansion and utility infrastructure. This may be tied to the recent push in urbanizing New Clark City.
Although most clusters relate to water and infrastructure in some form (since Water Resources is the sector with the most projects after Physical Connectivity), unsupervised clustering helped reveal distinct project focuses: from flood mitigation to agricultural irrigation, port development, and urban expansion. These insights can guide further regional analysis. It even showed the government's possible focus on developing New Clark City.
Overall Conclusion
This research study found that...
The current distribution of sustainability projects in the Philippines highlights a strong focus in developing the infrastructure of regions in and adjacent to Metro Manila. Region’s III, IV-A and the National Capital Region are driven by massive infrastructure projects such as the North-South Commuter Railway, Bulacan International Airport and the Subic-Clark-Manila-Batangas Dedicated Rail Corridor. These investments greatly improve public transportation and traffic congestion, and the prioritization of areas around Metro Manila can be attributed to its high population density and its role in the Philippine economy.
Additionally, the predominance of physical connectivity projects which account for 87.20% of the budget shows the priority of the Philippine government in enchancing transportation services. These transporation projects also come from highly populated areas like Region III, IV-A and NCR, reflecting the government's efforts to improve economic efficiency. However, the sheer amount of transportation infrastructure overshadow other types of projects from Water Resources and Agriculture, which are essential services in our rural communities.
this centralized approach to development leaves the other regions in the dust. Regions outside of the vicinity of Metro Manila receive fewer sustainability projects which reveals issues such as unequal access, slower regional growth, and inadequate infrastructure that stems from a lack of funding in national development plans. Neglecting these areas is especially concerning, as they are more vulnerable to climate change, lack basic services such as water, food and housing, and struggle with limited access to transportation, healthcare and education, all contributing to the widening gap in these communities as compared to the capital.
To reiterate, the goal of SGD 11 is to "Make cities and human settlements inclusive, safe, resilient and sustainable". Fulfilling this vision is giving each region a chance to improve their cities with national projects that solve their unique challenges.
About Us
Diana Mae D. de la Cruz
Currently a graduating 4th year BS Computer Science student under the Scientific Computing Laboratory. Usually found playing maimai.
Github link
Manuel Macaraig
Currently a graduating 4th year BS Computer Science student. If he's not coding, he's either making beats or cool posters :]
Github link